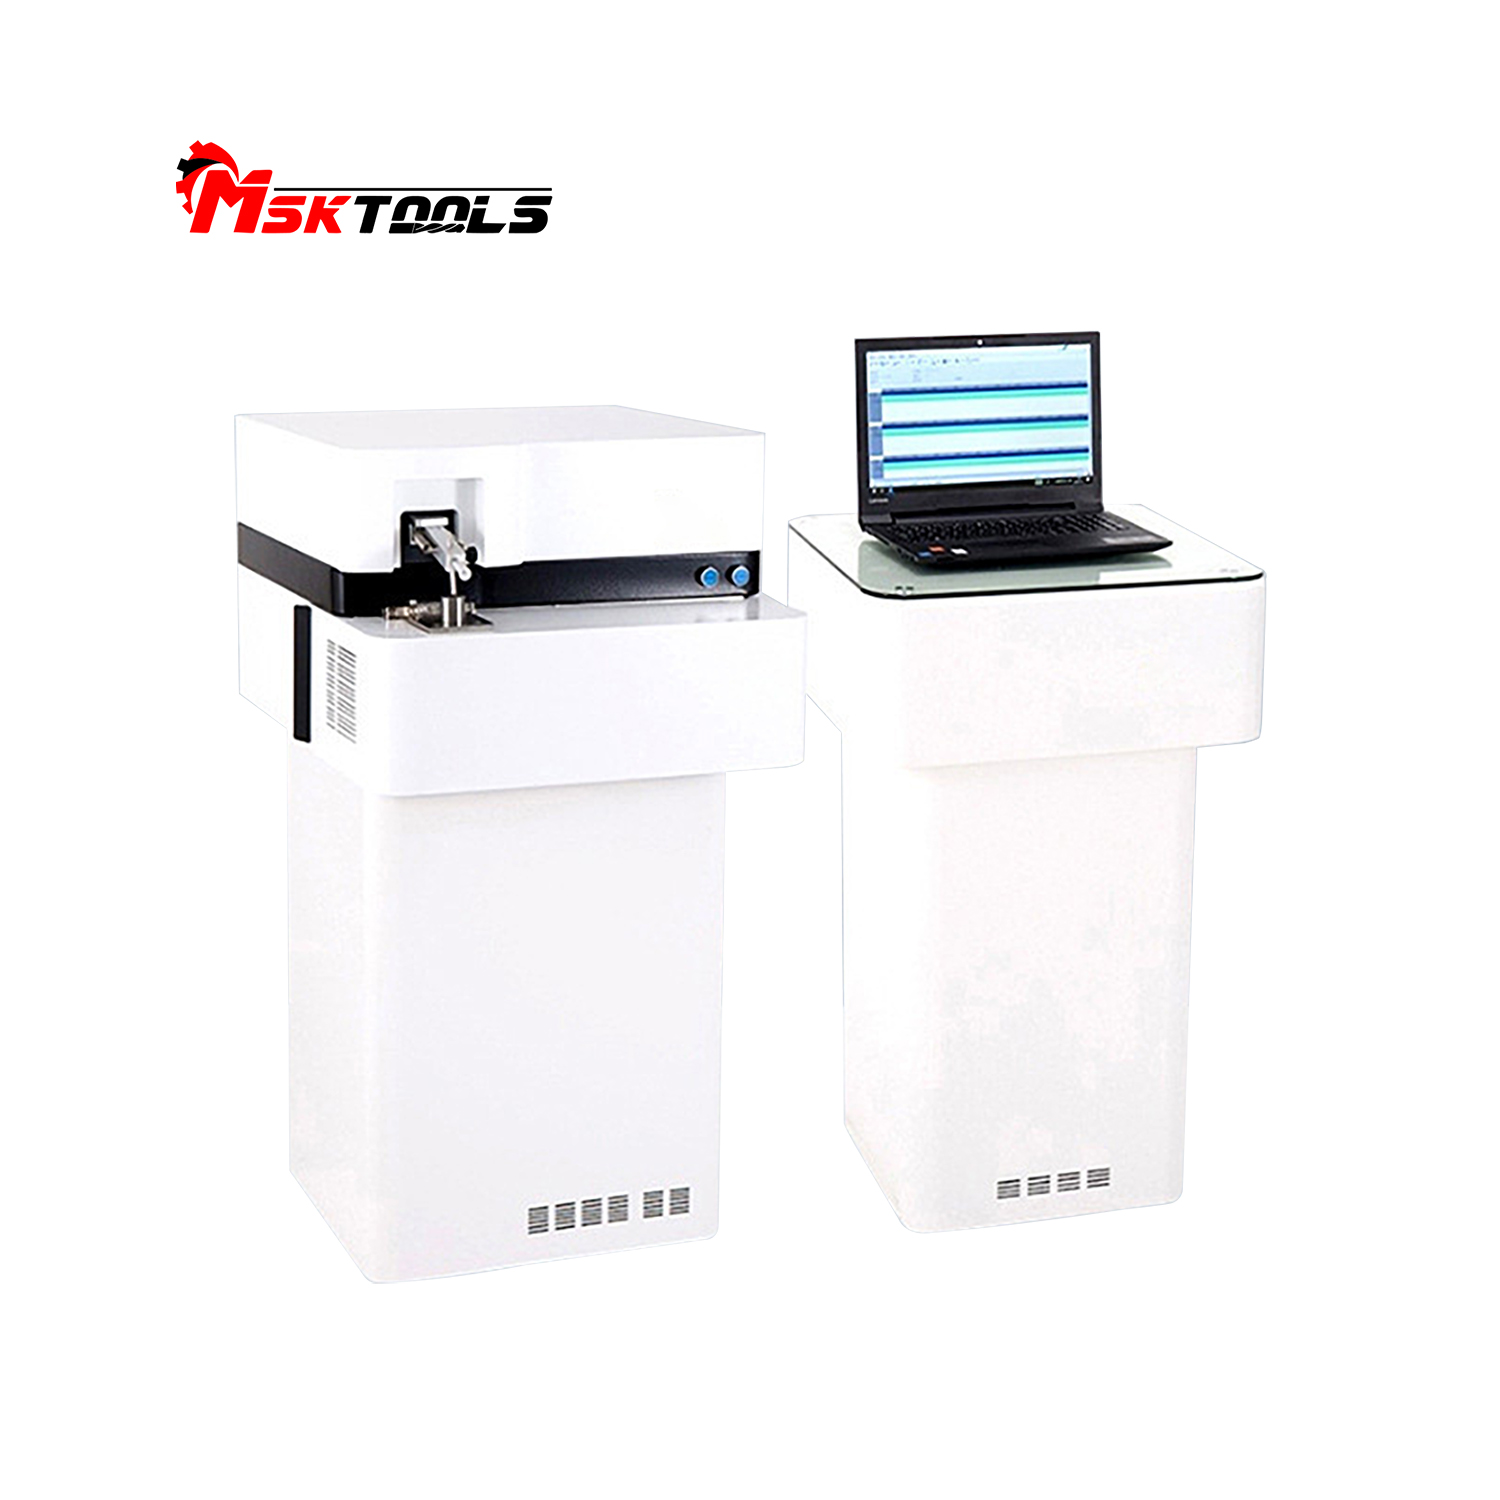
Full-Spectrum Spark Spectrometer for Metal Material Analysis



Product Information
| Detector | Multiple high-performance line-scan CCD | Air Pressure | 4-5bar |
| Average Power | 1200 W | Optical Drive | DVD |
| Standby Power | 70 W | Hard Disk | 250 GB |
| Wavelength Range | 170 - 800 nm | Current | 1-80A |
| Optical Chamber Temperature | 34℃± 0.5℃ | Memory | 1GB DDR 2 |
| Grating Groove Density | 2400l/mm | Frequency | 100 - 1000Hz |
| Product Diameter | 350mm | Chipset | AMD 690G + AMD SB600 |
| Pixel Resolution | 12pm | Monitor | 19-inch LCD Monitor |
| Spectral Line Dispersion | 1.5 nm/mm | Processor | AMD Dual-core 64X2 5200+ |
Iron Matrix Elements in Direct-Reading Spectrometers
CX-9600 Direct-Reading Spectrometer: Iron Matrix Elements, Selectable Analysis Ranges
| FE-000 | FE-001 | FE-002 | FE-003 | FE-004 | FE-005 | FE-006 | FE-007 | FE-008 | ||
| Serial No. | Element | General Line | Low Alloy Steel | Cast Iron | Cr/Ni Stainless Steel | High Manganese Steel | High-chromium cast iron | Cr Steel | High Speed Tool Steel | Ni Steel |
| 1 | C | 0.0015-4.3 | 0.0015-1.3 | 1.8-4.7 | 0.09-4.0 | 0.3-1.7 | 0.2-3.4 | 0.04-2.2 | 0.03-2.1 | 1.2-3.5 |
| 2 | Si | 0.001-5.6 | 0.03-2.1 | 0.2-4.7 | 0.12-1.6 | 5.3-23 | 0.1-2.5 | 0.1-1.4 | 0.04-1.5 | 0.04-1.5 |
| 3 | Mn | 0.001-19.6 | 0.03-2.1 | 0.06-4.5 | 0.012-16 | 5.3-23 | 0.1-2.4 | 0.1-1.5 | 0.04-1.7 | 0.001-2.1 |
| 4 | P | 0.0015-2.4 | 0.002-0.12 | 0.02-0.8 | 0.003-0.3 | 0.01-0.2 | 0.01-0.3 | 0.006-0.05 | 0.004-0.07 | 0.0015-0.56 |
| 5 | S | 0.0015-0.35 | 0.002-0.16 | 0.003-0.2 | 0.001-0.4 | 0.006-0.11 | 0.001-0.15 | 0.006-0.03 | 0.001-0.06 | 0.0015-0.24 |
| 6 | Cr | 0.001-32.1 | 0.01-4.5 | 0.03-10.5 | 7.4-32 | 0.08-3.8 | 0.4-34 | 7.8-24 | 1.8-14 | 0.0015-9.1 |
| 7 | Ni | 0.002-43.4 | 0.004-4.4 | 0.05-6.8 | 0.08-32 | 0.04-3.5 | 0.05-32 | 0.09-4.2 | 0.07-0.55 | 0.9-36.6 |
| 8 | Mo | 0.001-9.5 | 0.004-1.3 | 0.01-2.1 | 0.08-4.2 | 0.1-2.0 | 0.1-4 | 0.02-1 | 0.02-9.4 | 0.0015-1.5 |
| 9 | Al | 0.003-2.1 | 0.003-1.5 | 0.002-0.12 | 0.005-1.7 | 0.008-0.12 | 0.003-1.5 | 0.1-1.7 | 0.005-1.6 | 0.005-0.3 |
| 10 | Cu | 0.002-8.1 | 0.002-0.5 | 0.06-2.2 | 0.05-4.5 | 0.002-0.6 | 0.06-1.5 | 0.02-0.5 | 0.004-0.5 | 0.005-0.3 |
| 11 | Co | 0.001-17.9 | 0.001-0.5 | 0.008-0.03 | 0.008-17 | 0.007-0.1 | 0.001-0.5 | 0.01-0.5 | 0.008-8.0 | |
| 12 | Ti | 0.002-1.2 | 0.002-1.2 | 0.007-1.0 | 0.005-1.1 | 0.004-0.1 | 0.001-0.14 | 0.006-0.4 | 0.006-0.4 | 0.003-0.38 |
| 13 | Nb | 0.002-2.0 | 0.002-0.3 | 0.002-0.7 | 0.02-2.0 | 0.003-0.42 | 0.1-0.7 | 0.002-0.7 | 0.002-0.7 | 0.003-0.38 |
| 14 | V | 0.003-19.5 | 0.003-0.9 | 0.01-0.7 | 0.02-9.5 | 0.01-0.84 | 0.02-1.2 | 0.03-1.1 | 0.03-2.5 | |
| 15 | W | 0.03-19 | 0.03-2.1 | 0.007-1.0 | 0.002-4.1 | 0.03-2.1 | 0.03-2.1 | 0.05-0.7 | 0.06-19 | |
| 16 | Pb | 0.001-0.07 | 0.003-0.03 | 0.002-0.04 | 0.001-0.02 | 0.003-0.03 | 0.003-0.03 | 0.003-0.03 | 0.001-0.07 | |
| 17 | Mg | 0.001-0.14 | 0.001-0.14 | 0.001-0.14 | 0.001-0.14 | 0.001-0.14 | 0.001-0.14 | 0.001-0.14 | 0.001-0.14 | 0.005-0.025 |
| 18 | B | 0.006-0.5 | 0.006-0.02 | 0.002-0.5 | 0.007-0.02 | 0.009-0.02 | 0.006-0.02 | 0.006-0.02 | 0.006-0.02 | |
| 19 | Sn | 0.001-0.3 | 0.001-0.09 | 0.003-0.3 | 0.003-0.05 | 0.008-0.07 | 0.001-0.09 | 0.001-0.09 | 0.007-0.05 | |
| 20 | Zn | 0.002-0.4 | 0.002-0.04 | 0.005-0.3 | 0.002-0.08 | 0.002-0.07 | 0.002-0.04 | 0.002-0.04 | 0.002-0.04 | |
| 21 | Bi | 0.001-0.03 | 0.001-0.01 | 0.006-0.03 | 0.004-0.003 | 0.001-0.01 | 0.001-0.01 | 0.001-0.01 | 0.001-0.01 | |
| 22 | Ca | 0.0004-0.02 | 0.0004-0.002 | 0.0004-0.002 | 0.003-0.001 | 0.0004-0.002 | 0.0004-0.002 | 0.0004-0.002 | 0.004-0.02 | |
| 23 | Fe | Allowance | Allowance | Allowance | Allowance | Allowance | Allowance | Allowance | Allowance | Allowance |
Software Analysis Features
| Powerful Analysis Functions | Standardization of all or part of the calibration curve using single-point or two-point calibration methods Type calibration function Repeatability checks during calibration and analysis Add new calibration curves Add new standard samples to existing calibration curves Internal standard calibration function, matrix correction function Automatic switching of analytical lines Automatic extrapolation and flagging of analytical results outside the calibration curve range |
| Rich Data Output Forms | User-defined elements to be detected and display order User-defined types of elements to be detected, printed, or stored User-defined number of decimal places for detection, printing, or storage User-defined sample names Analysis results can be output as mass percentages or mass percentages of multiple relevant spectral lines in the form of substance content Intensity can be output as light intensity; analysis results can be presented using coefficient-calibrated intensity coefficients or corrected-calibrated intensity coefficients Mean, standard deviation, and relative standard deviation can be calculated for measurement results from any number of excitations |
| Data Storage and Printing Functions | Data is stored in the system’s built-in database Data can be stored in multiple formats Data can be stored as individual measurement results and/or averages of multiple test results Statistical data can be stored Stored data can be transferred manually or automatically Individual measurement results and/or averages of multiple test results can be printed Statistical data can be printed All stored data can be printed manually or automatically |
| Built-in diagnostic functions | Argon pressure monitor Vacuum status monitor Automatic spectral drift control Instrument calibration procedures and error log Displays all complete spectral data stored in the instrument and compares it with existing test spectra |
| Other Features | Grade Database and Custom Grade Input Function Grade Database Import and Export Function (via Excel) User-Defined Formula Input Function |
Precisely Accurate Identification and Trace Analysis
Optical System Design
Combining new CCD solid-state detector technology with optimized pixel resolution (12 pm) and new grating spectroscopy technology, this system represents a new generation of direct-reading spectroscopy for the digital age.
Design of the Vacuum Optical Chamber System
First, since there is no need for real-time argon purging of the optical chamber when the instrument is not in operation, argon consumption is significantly reduced, thereby lowering operating costs for customers.
The system reaches a stable operating state in just 30 minutes
Total Spectrum Acquisition (TSA) Technology
The instrument allows for the convenient addition of spectral lines and matrices, enabling multi-matrix analysis without the need for additional hardware
About Us
Factory Profile
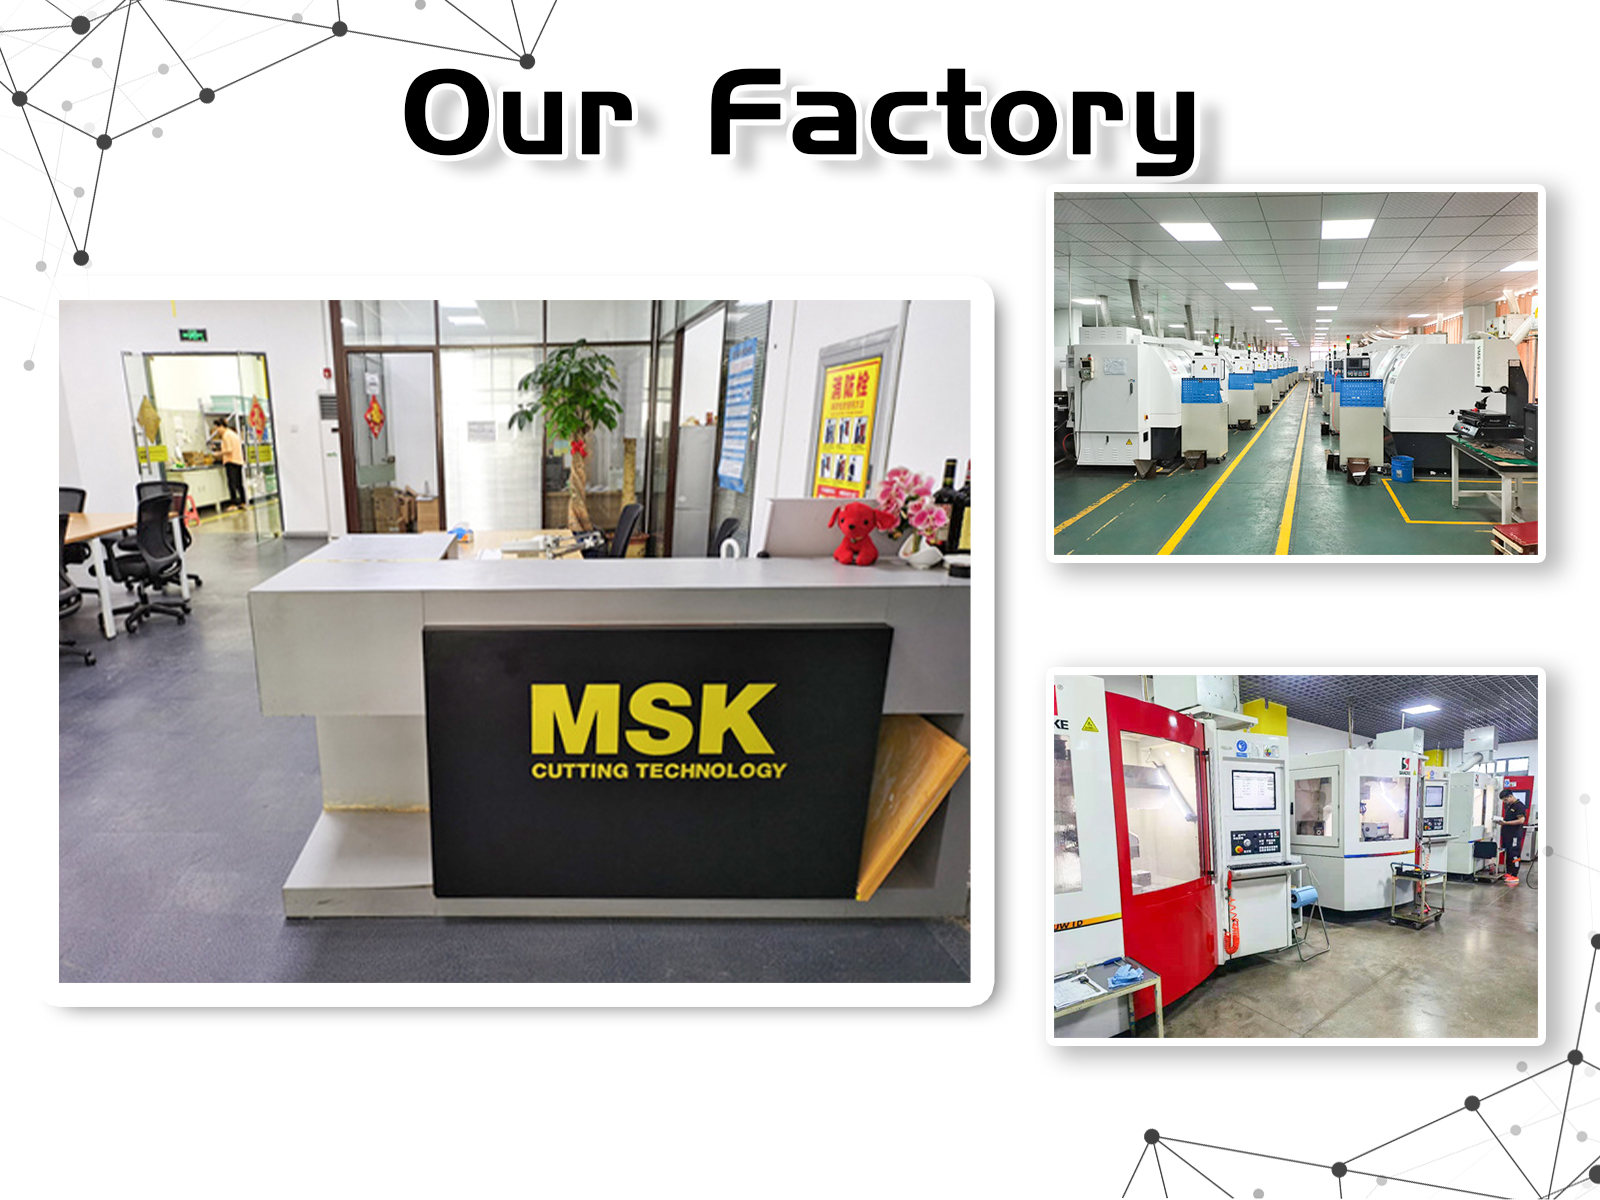
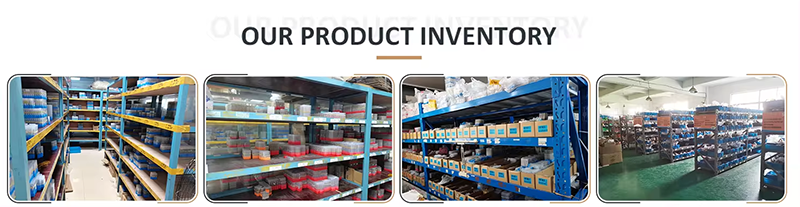
Why Choose Us





FAQ
Q1: Who are we?
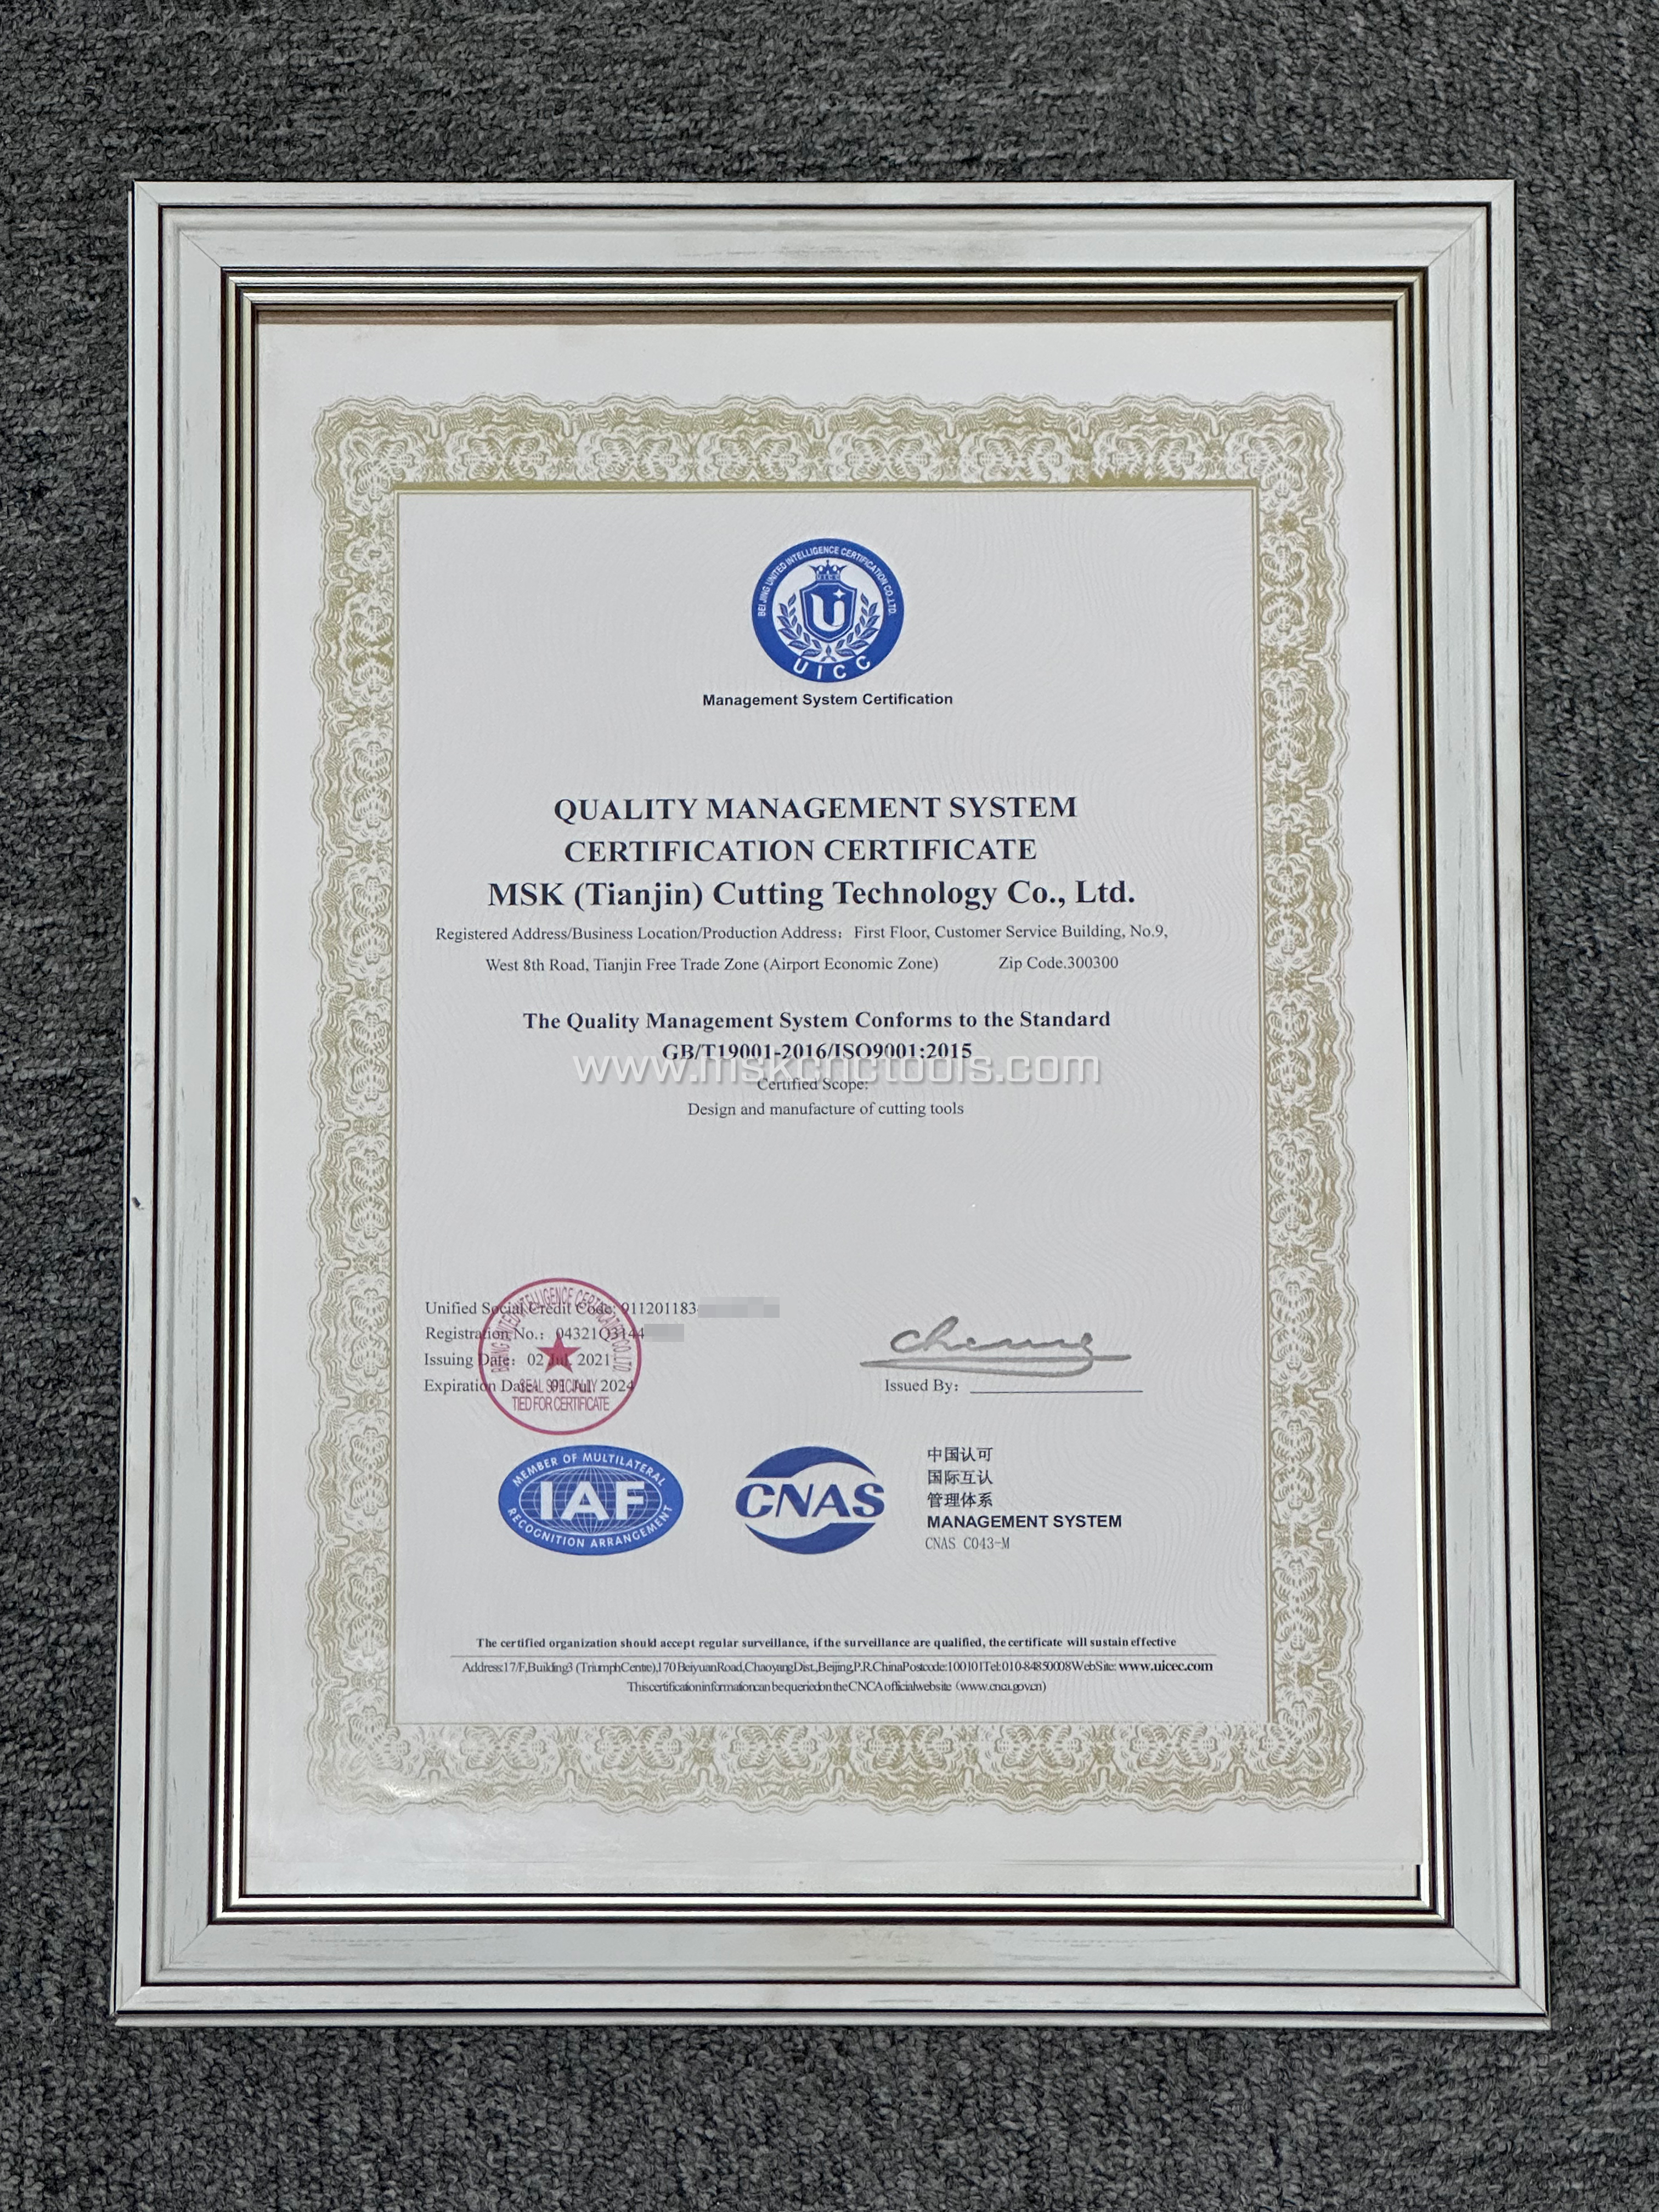
A1: Founded in 2015, MSK (Tianjin) Cutting Technology CO.Ltd has grown continuously and passed Rheinland ISO 9001
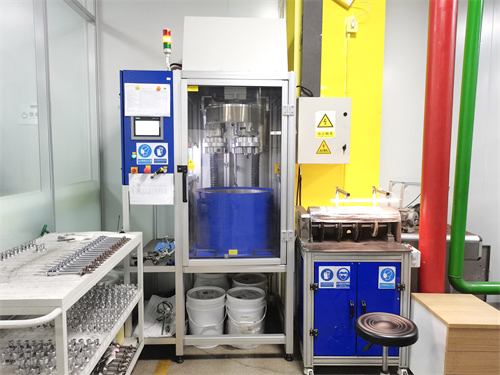
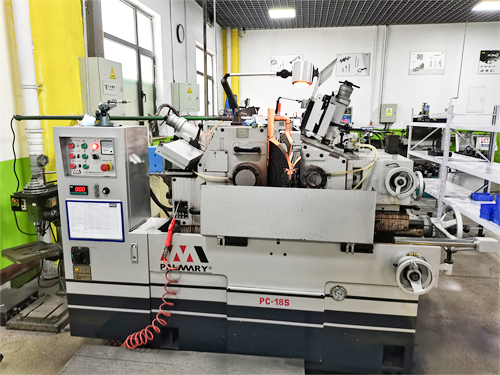
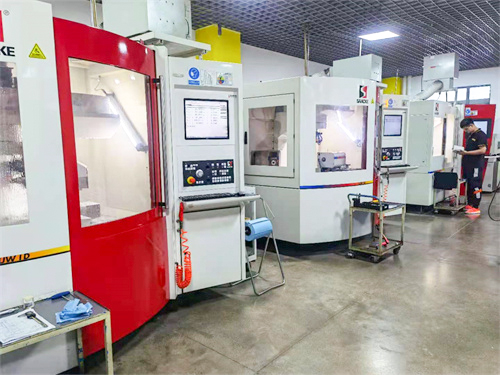
authentication.With German SACCKE high-end five-axis grinding centers, German ZOLLER six-axis tool inspection center, Taiwan PALMARY machine and other international advanced manufacturing equipment, we are committed to producing high-end,professional and efficient CNC tool.
Q2: Are you trading company or manufacturer?
A2: We are the factory of carbide tools.
Q3: Can you send products to our Forwarder in China?
A3: Yes,if you have Forwarder in China,we will glad to send products to him/her.
Q4: What terms of payment are acceptable?
A4: Normally we accept T/T.
Q5: Do you accept OEM orders?
A5: Yes, OEM and customization are available, and we also provide label printing service.
Q6: Why should you choose us?
A6:1) Cost control - purchasing high-quality products at an appropriate price.
2) Quick response - within 48 hours, professional personnel will provide you with a quote and address your concerns.
3) High quality - The company always proves with sincere intention that the products it provides are 100% high-quality.
4) After sales service and technical guidance - The company provides after-sales service and technical guidance according to customer requirements and needs.